You are using an out of date browser. It may not display this or other websites correctly.
You should upgrade or use an alternative browser.
You should upgrade or use an alternative browser.
2017 Attendance Thread
- Thread starter Seth
- Start date
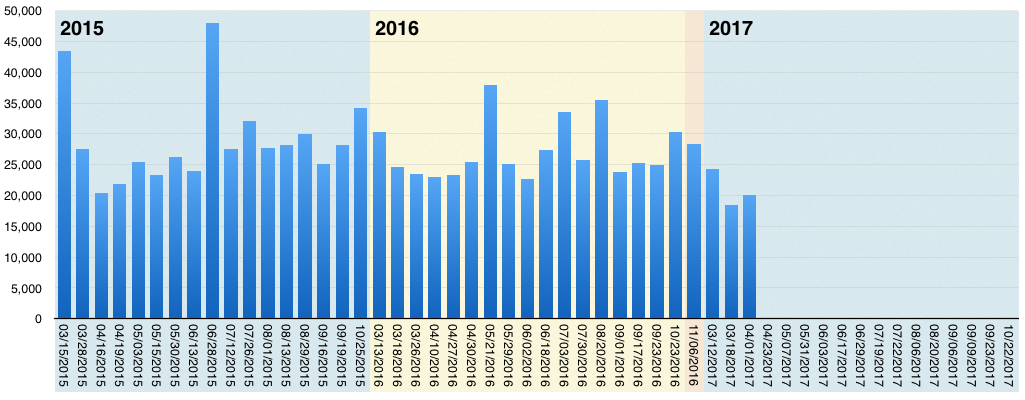
This city is a sucker for big events and marquee stars, and comparatively weak at just showing up for everything else. Opening days, closing days, RB games, Pirlo's first, Gerrard and the Galaxy visiting, even the end of the season all get decent large bumps.Not sure how many years wide I can keep this but so far three seems to be manageable.
Can't help wonder how much 7-0 hurt the second derby last year, and how much was due to being on a long weekend. Also 5 games last year outdrew the playoff game. How much of that was losing the first game 2-0?
Another factor to consider is the hideous home start last year, winning only 1 of the first 9 home games. The home record has been great since, but there can often be a lag between results and attendance. How many people went to 7-8 of the first 9 games, decided to give up tickets, maybe only went to 3-4 games the rest of the way, and never really noticed the team has since become very strong and fun to watch at home?
This city shows up to see a broken down Carmelo Anthony 41 times a year. They don't give two shits about Maxi Moralez or Jack Harrison.
You want attendance, put Wayne Rooney on the pitch.
Attendance picked up in 2015 when Lampard arrived.
Sadly, this appears true. Should have signed Balotelli when we may have had the chance.
Your point is completely valid but I'd rather have good attendance because soccer is getting more popular rather than "simply" because we won the cup or have a big star or two. Yeah, I know, reality, whatevs, but I'd like to see enough people like the game well enough so that they *would* come to see Harrison play.This city shows up to see a broken down Carmelo Anthony 41 times a year. They don't give two shits about Maxi Moralez or Jack Harrison.
You want attendance, put Wayne Rooney on the pitch.
Attendance picked up in 2015 when Lampard arrived.
Nice post, Seth.
Not sure if I will update this very often, but here is the template I used in past seasons.
Game 1 - DC United - 24,259 (Sun, 5pm)
Game 2 - Montreal - 18,515 (Sat, 2pm)
Game 3 - San Jose - 20,066 (Sat, 2pm)
Game 4 - Chicago - To Come (Sun, 7pm)
Game 5 - Montreal - To Come (Wed, 7pm)
Game 6 - Vancouver - To Come (Sat, 4pm)
Game 7 - New Jersey - To Come (Sat, 3pm)
Game 8 - Orlando - To Come (Sun, 4pm)
Game 9 - Real Salt Lake - To Come (Thur, 7pm)
Game 10 - Philadelphia - To Come (Sat, 1pm)
Game 11 - New Jersey - To Come (Sun, noon)
Game 12 - Colorado - To Come (Sat, 3pm)
Game 13 - LA Galaxy - To Come (Sat, 3:30pm)
Game 14 - DC United - To Come (Thur, 7pm)
Game 15 - Dallas - To Come (Sat, 7pm)
Game 16 - Chicago - To Come (Fri, 8pm)
Game 17 - Columbus - To Come (Sun, 4pm)
Hi - DC United, 24,259
Lo - Montreal, 18,515
Total - 62,840
Avg - 20,947
Avg (w/o hi/lo) - 20,066
Median - 20,066
Avg Sat:
Avg Sun:
Avg Weeknight:
Avg Friday Night:
Avg Weekend Day:
Avg Weekend Night:
Here are the raw data for 2015 and 2016.
2015
Attendance Thread
Game 1 - New England - 43,507 (Sun, 5pm)
Game 2 - Kansas City - 27,545 (Sat, 7pm)
Game 3 - Philadelphia - 20,461 (Thur, 7pm)
Game 4 - Portland - 21,891 (Sun, 7pm)
Game 5 - Seattle - 25,384 (Sun, 7pm)
Game 6 - Chicago - 23,315 (Fri, 7pm)
Game 7 - Houston - 26,211 (Sat, 7pm)
Game 8 - Montreal - 24,042 (Sat, 7pm)
Game 9 - New Jersey - 48,047 (Sun, 5pm)
Game 10 - Toronto - 27,533 (Sun, 3pm)
Game 11 - Orlando - 32,041 (Sun, 2:30pm)
Game 12 - Montreal - 27,645 (Sat, 2pm)
Game 13 - DC United - 28,262 (Thur, 7pm)
Game 14 - Columbus - 30,018 (Sat, 4pm)
Game 15 - Toronto - 25,075 (Wed, 7:30pm)
Game 16 - San Jose - 28,321 (Sat, 7pm)
Game 17 - New England - 34,150 (Sun, 5pm)
Hi - New Jersey - 48,047
Lo - Philly - 20,461
Total - 493,448
Avg - 29,026 (3rd in MLS)
Avg (w/o hi/lo) - 28,329
Median - 27,545
Average first 8 - 26,545
Average last 9 - 31,232
(The following exclude Games 1 and 9)
Avg Sat: 27,297
Avg Sun: 28,200
Avg Worknight: 24,278
Avg Weekend Day: 30,277
Avg Weekend Night: 25,566
2016
Attendance Thread
Game 1 - Toronto - 30,315 (Sun, 5pm)
Game 2 - Orlando - 24,597 (Fri, 7pm)
Game 3 - New England - 23,425 (Sat, 3pm)
Game 4 - Chicago - 22,930 (Sun, 7pm)
Game 5 - Montreal - 23,352 (Wed, 7pm)
Game 6 - Vancouver - 25,438 (Sat, 4pm)
Game 7 - New Jersey - 37,858 (Sat, 3pm)
Game 8 - Orlando - 25,039 (Sun, 4pm)
Game 9 - Real Salt Lake - 22,736 (Thur, 7pm)
Game 10 - Philadelphia - 27,456 (Sat, 1pm)
Game 11 - New Jersey - 33,613 (Sun, noon)
Game 12 - Colorado - 25,711 (Sat, 3pm)
Game 13 - LA Galaxy - 35,509 (Sat, 3:30pm)
Game 14 - DC United - 23,768 (Thur, 7pm)
Game 15 - Dallas - 25,204 (Sat, 7pm)
Game 16 - Chicago - 25,011 (Fri, 8pm)
Game 17 - Columbus - 30,374 (Sun, 4pm)
Hi - New Jersey, 37,858 (2015 - New Jersey, 48,047)
Lo - Real Salt Lake, 22,736 (2015 - Philly, 20,461)
Total - 462,336 (2015 - 493,448)
Avg - 27,196 (2015 - 29,026)
Avg (w/o hi/lo) - 26,783 (2016 - 28,969)
Median - 25,438 (2015 - 27,545)
Avg Sat: 28,657 (2015 - 28,907)
Avg Sun: 28,454 (2015 - 33,222)
Avg Weeknight: 23,285 (2015 - 24,599)
Avg Friday Night: 24,804 (2015 - 23,315 for one game)
Avg Weekend Day: 29,474 (2015 - 33,721)
Avg Weekend Night: 24,067 (2015 - 25,566)
Not sure how many years wide I can keep this but so far three seems to be manageable.
Not sure if this is easy for you to do, but it would be great to see a 3- or 5-game moving average.
Well crap, now I have homework.Not sure if this is easy for you to do, but it would be great to see a 3- or 5-game moving average.
I get my numbers from here:Here are the raw data for 2015 and 2016.
2015
Attendance Thread
Game 1 - New England - 43,507 (Sun, 5pm)
Game 2 - Kansas City - 27,545 (Sat, 7pm)
Game 3 - Philadelphia - 20,461 (Thur, 7pm)
Game 4 - Portland - 21,891 (Sun, 7pm)
Game 5 - Seattle - 25,384 (Sun, 7pm)
Game 6 - Chicago - 23,315 (Fri, 7pm)
Game 7 - Houston - 26,211 (Sat, 7pm)
Game 8 - Montreal - 24,042 (Sat, 7pm)
Game 9 - New Jersey - 48,047 (Sun, 5pm)
Game 10 - Toronto - 27,533 (Sun, 3pm)
Game 11 - Orlando - 32,041 (Sun, 2:30pm)
Game 12 - Montreal - 27,645 (Sat, 2pm)
Game 13 - DC United - 28,262 (Thur, 7pm)
Game 14 - Columbus - 30,018 (Sat, 4pm)
Game 15 - Toronto - 25,075 (Wed, 7:30pm)
Game 16 - San Jose - 28,321 (Sat, 7pm)
Game 17 - New England - 34,150 (Sun, 5pm)
Hi - New Jersey - 48,047
Lo - Philly - 20,461
Total - 493,448
Avg - 29,026 (3rd in MLS)
Avg (w/o hi/lo) - 28,329
Median - 27,545
Average first 8 - 26,545
Average last 9 - 31,232
(The following exclude Games 1 and 9)
Avg Sat: 27,297
Avg Sun: 28,200
Avg Worknight: 24,278
Avg Weekend Day: 30,277
Avg Weekend Night: 25,566
2016
Attendance Thread
Game 1 - Toronto - 30,315 (Sun, 5pm)
Game 2 - Orlando - 24,597 (Fri, 7pm)
Game 3 - New England - 23,425 (Sat, 3pm)
Game 4 - Chicago - 22,930 (Sun, 7pm)
Game 5 - Montreal - 23,352 (Wed, 7pm)
Game 6 - Vancouver - 25,438 (Sat, 4pm)
Game 7 - New Jersey - 37,858 (Sat, 3pm)
Game 8 - Orlando - 25,039 (Sun, 4pm)
Game 9 - Real Salt Lake - 22,736 (Thur, 7pm)
Game 10 - Philadelphia - 27,456 (Sat, 1pm)
Game 11 - New Jersey - 33,613 (Sun, noon)
Game 12 - Colorado - 25,711 (Sat, 3pm)
Game 13 - LA Galaxy - 35,509 (Sat, 3:30pm)
Game 14 - DC United - 23,768 (Thur, 7pm)
Game 15 - Dallas - 25,204 (Sat, 7pm)
Game 16 - Chicago - 25,011 (Fri, 8pm)
Game 17 - Columbus - 30,374 (Sun, 4pm)
Hi - New Jersey, 37,858 (2015 - New Jersey, 48,047)
Lo - Real Salt Lake, 22,736 (2015 - Philly, 20,461)
Total - 462,336 (2015 - 493,448)
Avg - 27,196 (2015 - 29,026)
Avg (w/o hi/lo) - 26,783 (2016 - 28,969)
Median - 25,438 (2015 - 27,545)
Avg Sat: 28,657 (2015 - 28,907)
Avg Sun: 28,454 (2015 - 33,222)
Avg Weeknight: 23,285 (2015 - 24,599)
Avg Friday Night: 24,804 (2015 - 23,315 for one game)
Avg Weekend Day: 29,474 (2015 - 33,721)
Avg Weekend Night: 24,067 (2015 - 25,566)
http://matchcenter.mlssoccer.com/ma...york-city-fc-vs-san-jose-earthquakes/boxscore
I do the chart in Numbers on a Mac, so I do have the data behind it in a spreadsheet but I'm considering getting a better charting program so I can do, well, better charts. Like I'd love to be able t0 put the weather on the bars, for example (Rainy 34°). Used to do crazy charts in DeltaGraph perhaps a billion years ago so maybe I'll look into it.
I get my numbers from here:
http://matchcenter.mlssoccer.com/ma...york-city-fc-vs-san-jose-earthquakes/boxscore
I do the chart in Numbers on a Mac, so I do have the data behind it in a spreadsheet but I'm considering getting a better charting program so I can do, well, better charts. Like I'd love to be able t0 put the weather on the bars, for example (Rainy 34°). Used to do crazy charts in DeltaGraph perhaps a billion years ago so maybe I'll look into it.
Going to need the R^2 too, thanks.
There seems to be a lot more people coming from the metro north train station than the subway this year. It's just an observation after going to the games this year vs last year and the first year.
I don't know what that means re: attendance numbers but the subway traffic is down considerably.
I don't know what that means re: attendance numbers but the subway traffic is down considerably.
The subway has been atrocious this year with no 4 service from Brooklyn, and this past weekend the D was rerouted & local from Brooklyn to Columbus Circle. The MTA doesn't give any fcks about games.There seems to be a lot more people coming from the metro north train station than the subway this year. It's just an observation after going to the games this year vs last year and the first year.
I don't know what that means re: attendance numbers but the subway traffic is down considerably.
The subway has been atrocious this year with no 4 service from Brooklyn, and this past weekend the D was rerouted & local from Brooklyn to Columbus Circle. The MTA doesn't give any fcks about games.
I ended up taking the 2 train to the stadium last week, which I've never done before. Luckily there was a 4 train waiting at 149th grand concourse so I transferred.
Metro North is a great way to go if you are anywhere near GCS or Harlem or can get there easily. Yankee Stadium is the first stop after Harlem, and you can buy beer at GCS and drink it on the train.
Unfortunately, Metro North does not run trains from Westchester/Connecticut direct to the stadium as they do for Yankee games, so you have to transfer at Harlem. Service is too infrequent on weekends to make this a decent alternative to driving.
Unfortunately, Metro North does not run trains from Westchester/Connecticut direct to the stadium as they do for Yankee games, so you have to transfer at Harlem. Service is too infrequent on weekends to make this a decent alternative to driving.
There seems to be a lot more people coming from the metro north train station than the subway this year. It's just an observation after going to the games this year vs last year and the first year.
I don't know what that means re: attendance numbers but the subway traffic is down considerably.
i guess depends on who you are talking too....the general crowd i see all use subway or use Subway and LIRR
Easy to do in Excel thankfullyWell crap, now I have homework.
There seems to be a lot more people coming from the metro north train station than the subway this year. It's just an observation after going to the games this year vs last year and the first year.
I don't know what that means re: attendance numbers but the subway traffic is down considerably.
I live in curry hill, so grand central isn't such a bad walk that I need to take the subway. Since the subway takes me about an hour and 20 once walking is factored in, and metro north takes about 38 mins to the stadium, including walking, why not take Metro North? If I time it right I just pay the extra $5 and shave about 50 mins off of my commute to the match.
My marginal rate of substitution for an hour of my day is well over the $5 additional cost of taking metro north. So why take the subway?
This city shows up to see a broken down Carmelo Anthony 41 times a year. They don't give two shits about Maxi Moralez or Jack Harrison.
You want attendance, put Wayne Rooney on the pitch.
Attendance picked up in 2015 when Lampard arrived.
if thats true then not much has changed and "soccer is here" is not really true for the US
as for the knicks lots of people are tourists ( at least in my limited experiences in the garden this season) being in MSG is a bucketlist type thing for outsiders...rangers attendance may be a better indicator to me.
still to me ...title and winning on field > attendance.....i get it, if attendance gets worse bad things can happen etc. but still.
Happily it turns out it was only a couple of extra clicks to turn it on.Not sure if this is easy for you to do, but it would be great to see a 3- or 5-game moving average.
3-match moving average:
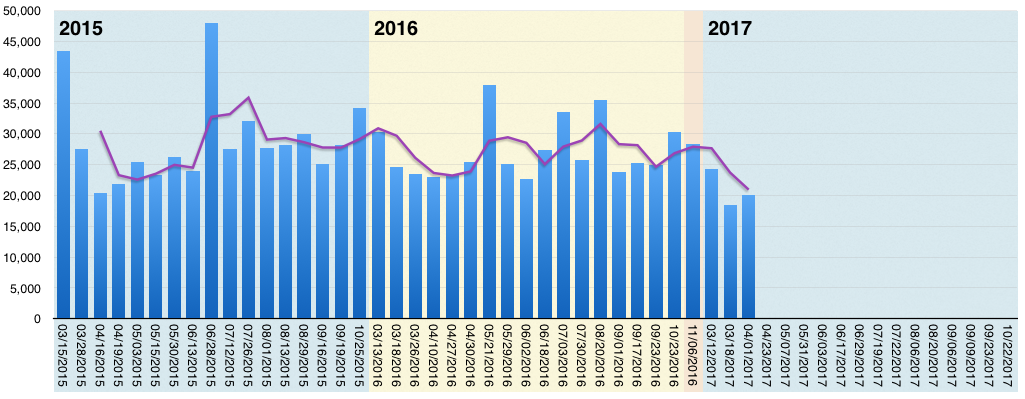
5-match moving average:

Include one of those in the future perhaps?
Similar threads
- Replies
- 19
- Views
- 902
- Replies
- 7
- Views
- 609