NYCFC Season Discussion 2025: Party Like It's 2023 (2024 If You're Lucky)

Good stuff.

Some random thoughts on what might create a lot of one-goal victories.

Break it into two parts - what creates a lot of victories and what creates a lot of one-goal games.

Victories are created by being good (or lucky). Such a team is going to have more wins that other results, and so it will it is likely to have better results in one-goal games - more wins than losses or draws.

A team that is strong on defense is going to have more one-goal games than a team that is weak on defense. Lower scoring games are going to lead to closer results.

Thus, a team that is very good (or lucky) and has a strong defense should tend to have the most wins in one-goal games.
I'm not sure that's right. Or only partly right. Conceding fewer goals usually leads to more low margin games, but even more so when combined with a poor offense.
Games that end 0-0, 1-0 and 0-1 are by definition low margin games. Someone has to score 2 or more for a game to be decided by 2. As either teams scores 3, or 4, or 5 etc., the likelihood of a non-close score increases. If you have a great defense but also a good number of multi-goal games, you won't have many low margin games (which is of course very good).

The 2023 Edition of NYCFC scored 35 and allowed 39, both slightly more than 1 per game. Only 2 teams scored fewer and only 4 allowed fewer that year. It's no surprise they ended with 14 ties, most in team history. Next closest is 10.

That said, theres a lot of randomness in this. 2019 NYCFC has the second most draws in team history, despite a +18 GD and also the most goals scored in team history.

Finally, 2025 NYCFC is only moderately good on defense. Nine teams have conceded fewer goals. Our 9 clean sheets is also tied for 9th in the league. We have excelled at limiting defensive fiascos. Only 1 team has conceded 3 or more goals fewer times than NYCFC.

So basically, the trick to having a good record in 1 goal games is to just be a somewhat good team. Not great, because then you would win more games by bigger margins, not average because then you would have more draws and few multi goal losses.

I'd say that fits us. We are better than average.
 
So basically, the trick to having a good record in 1 goal games is to just be a somewhat good team. Not great, because then you would win more games by bigger margins, not average because then you would have more draws and few multi goal losses.

I'd say that fits us. We are better than average.
It mostly tracks, but when it really doesn't, for the extreme outliers, that's where the luck comes in.

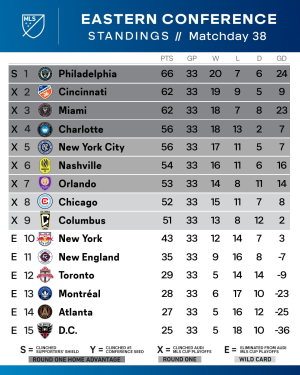
Nashville has a GD of +16 but sits 3 points behind us because their 1-goal game record is 8-8 while ours is 11-6. Nashville's W-L is much better when the score is not close, 8-3. Maybe Nashville just is bad at 1 goal games? But that theory is a hard sell because Nashville just won the USOC going 3-0 in one goal games. How can Nashville be poor in 1 goal games but be perfect in a tournament when it matters most? That makes no sense.

That's not unlike 2021 NYCFC. That team went 6-9 in one goal games during the season, then won 4 playoff matches with a combined goal differential of +3. 2021 NYCFC was absurdly unlucky almost all season until the very end, but nobody wanted to hear it, including most NYCFC fans. I wrote a 2,250 word post - crazy long even for me - on September 17 whose point was NYCFC was epically unlucky in multiple ways and so don't blame the coach and expect things to turn around. People liked it, but few believed it. In fact NYC got just 3 points in the next 6 games and I looked like a fool. Then luck changed and by December everyone* loved Ronny, but sadly not because of my post.
IMG_4983.PNG
In every sport that I know enough to have an opinion, a record in 1 score games that is very far from its run, goal, or point differential reverts to the mean over a sufficiently large number of games. I think the emerging consensus across sports is that the record in close games is not entirely luck, which is where the trend settled 10-12 years ago and which I still believed in 2021. I think now the consensus is more that some teams really are a bit better or worse at prevailing in close finishes. But just a bit. Extreme records in close games are still mostly luck, and most teams have a record in close games that is not deviations away from their overall record. Extreme can be 8-8 for a team like Nashville with a +16 goal differential. The best explanation for why they don't have a winning record in 1-goal MLS games is luck. They simply deserve and should have a better record. OTOH 3-0 in 1 goal games in USOC is kind of lucky so maybe not a bad trade.

If the trick to having a good record in 1 goal games is to just be a somewhat good team then the trick to having a bad record in 1 goal games is to just be a somewhat bad team. But 2021 NYCFC was not somewhat bad, mostly bad or slightly bad. They were pretty excellent and really, really, unlucky, until thankfully they weren't unlucky.

* Except Union fans. To this day, Philadelphia Union fans are convinced we should not have beaten them and maybe could not have beaten them without their Covid outbreak, because they finished with more points and had an excellent home record. But NYCFC was the much better team, with a GD that exceeded Philly by 7 and an xGD that exceeded Philly by 16.5. NYCFC was so much better than them, in every way but luck, until that luck changed in a very big way.
 
I love the statistical evaluation of this, I also wonder about the game play evaluation. Think, where do 1-goal games come from?

Consider 3 different matches at the 75' mark:
  1. A tie game
  2. A 1-goal game
  3. A 2-goal game
I think coaching decisions and certain specific team skills can influence what happens in these situations significantly. Imagine a team that (a) goes very aggressive in chasing a goal (i.e., pushing more players higher up the pitch than normal/average teams) and (b) goes very conservative in killing a game (i.e., dribbling to the corner, knocking the ball around the back, time wasting arts, always opting for time off the clock over going for the next goal).

Take #1 above. A tie game in the 75' will tend toward ending in a tie or a win for the home team as away teams are more likely to play for the tie. Our great 1-goal game team is more aggressive than most while playing at home, and so more likely to find the winner. They may also be slightly more likely to give up the losing goal. But playing to the home field effect, the odds tilt a bit in their favor. OTOH, on the road they are exceptionally skilled at killing off the closing minutes on the clock, thus avoiding more 1-goal losses than the average team.

#2. When the game gets to 75' and the great 1-goal team is ahead, their game killing skills secure the win without going for the 2nd goal which would take away the 1-goal win. When they get to 75' behind by 1, they play a more aggressive style than other teams leading to a greater likelihood of either a tying goal - tie = no 1-goal loss - or giving up the counter - 2-goal loss = no 1-goal loss.

#3. When our great 1-goal team is down by 2, again they are more aggressive than average teams, increasing the likelihood they cut the lead in half and yes if they don't score again, they will end with a 1-goal defeat. But they also then filter back into the #2 scenario above giving themselves a higher than average chance of ending in a tie or back at a 2-goal loss. When our team is up by 2, they are great at killing the clock, thus giving up fewer times when they end in a 1-goal win.

Scenario #3 actually works against our great 1-goal team getting more 1-goal wins. But scenarios 1 and 2 are much more common. So overall, these 2 skills / strategies can influence who gets more 1-goal wins.

I'm not discounting luck. But I think a team who plays this way will have a better than average 1-goal record.
Do you think Ronny was a bad coach in close games?
 
Do you think Ronny was a bad coach in close games?
I wasn't applying this to any specific coach. It was more of a thought experiment.

However I do think that most coaches are more willing to settle for ties than I would prefer. I think too few play the odds of going for wins and accepting the losses that come. I'd much rather a team with 17 wins and 17 losses vs 34 ties. Really you only need to get to 12 wins to beat the 34 tie point total. Now the flip side is that the 12 win, 22 loss team gave a lot of points to opponents who they are trying to beat in the standings. But I think teams generally don't go all out for the win as much as the economist would have them do.
I realized after I posted that my question might have seemed like a gotcha or challenge, which was not my intent. I appreciate the response.

Truth is, unless you are predisposed to assume it's definitely luck, the evidence that Ronny was a poor in 1-goal games is clear, at least with NYCFC. The counter evidence is basically that 71 games - less than a half baseball season - is still not a huge sample.

That aside, I thought about it more and it turns out that NYC's 1-goal game record this year is not really anomalous. I don't have time to explain now but I'll get to that, plus a bit more on Deila, in a day or two.

Final short note is yesterday's game is a near perfect example of why close games are heavily driven by luck. The xG was so close the models disagree which team generated more. Arguably 1-0, 1-1, and 0-1 or 0-0 were all fair scores. Only goal came off a deflection, which is heavily luck driven. Not all close games lean that heavily to chance, but it wasn't that unusual either.
 
Maybe NYCFC's record in close games is not as great as I thought.
Last week I noticed that NYC had the second most wins in 1-goal games, was top 3-4 in W-L ratio, and had few ties. I thought this relative excellence also meant NYCFC had an objectively good record. Then I dug some more.

I decided to compare the 1-goal game records to those in other games. I'm going to exclude the Union game result just to keep the data static as of when I first looked at this. Ignoring ties, NYC was 9-5 in 1-goal games and 8-5 in all others. In that light, the 1-goal game record looks a lot less impressive. Then I decided this needed an adjustment to account for draws. On the whole, draws are not a good result for a winning team. Situationally you might be happy to draw if you're losing late or playing a good team at their home, but in aggregate draws are bad. NYCFC has only 5 draws. Only 2 teams have fewer (Charlotte and RSL).* But we should still include them in the analysis, so I counted draws as 1/3 of a win and 2/3 of a loss. Adjusted this way, NYC's 1-goal record is 10.67W-8.33L which is actually slightly worse than the record in other games, but very close as a percentage, with a difference of 0.05.

I'm left unsure how to measure this: does it matter more that NYC has a top 3 or 4 record in close games in MLS but only top 10-12 in other games? Or is the better comparison between NYC in close games and NYC in other games? I'm still pondering.

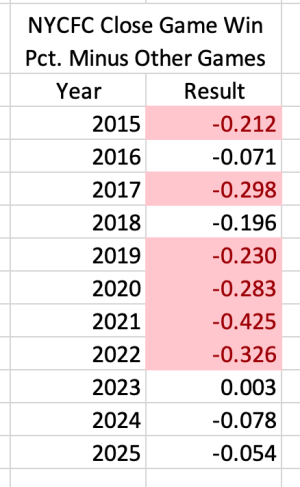
Still, I decided to compare NYC seasons measured by the relative percentage performance in close games to the percentage performance in all other games because I had the data ready and why not.
Screenshot 2025-10-06 at 7.57.56 AM.png

Red entries are below average. The average is -0.20. I don't know how this compares to other teams and probably won't bother collecting the data to find out. But this is the second best NYC record in 1-goal games by this metric, so maybe it is somewhat extreme and unlikely to repeat next year.
Or, maybe Jansen is good in close games in the same way Deila was bad. The record in 2020-22 is terrible, and the 2022 split between Deila and Cushing doesn't really help Ronny much. They were both poor that year in close games.

Other thoughts:
- Excluding ties, it makes sense that good teams will have a worse record in close games because you're allowing chance to play a bigger role, and if your team is good, luck tends to make things worse.
- Once you include ties, it makes even more sense because ties are bad, especially for good teams. NYCFC has had mostly good teams.
- It does not surprise me that 2023 is the only year where close games were better than others, because 2023 was a bad team, but had a good defense, and Nick played to keep scores low, and ended with 14 ties, mostly 1-1, which is a lot. Playing for low scores means more close games means probably making luck a bigger factor, and when you're not good, that's not a terrible choice. If they played more open in 2023 it probably leads to fewer ties and more losses. It doesn't have to work out but it can. It won't make you good but it will make you slightly less worse. Still, he should have moved further from this in 2024.

I've no grand conclusion to offer. I'm leaning to believing that the 2025 team's record in close games is a bit extreme, but not nearly as much as I thought.

* Draws are also bad for the MLS tie breaker matrix, because total wins is the first element. Really bad luck for NYC that the only team we care about with respect to a potential tie-breaker is 1 of 2 teams with fewer draws.

 
Last edited:
Interesting. I am a little uncomfortable with how ties get treated in the analysis, but I can't get my head around why.

One thing is that ties provide fewer points on average and only games decided by one point or fewer include ties, so that effect only shows up on one side. Following on from that, the deficit that one goal games will have compared to multi-goal games will be higher in seasons that have more ties even if the win-loss ratio is the same. Not sure whether any of that matters, but I am pondering.
I considered all that and chose this method because:
  • Pretending they don't exist ignores a significant part of the season. If we finish with 5 ties, which is quite low, that's still 15% of the season. I don't think you're advocating for ignoring them but this is worth stating.
  • This method accounts for all games and all potential points. With the 1/3 & 2/3 allocation the games add up to 34 in a full season.
    • In a 34 game season there are 102 potential points. Wins earn 3 points and losses drop 3. A tie earns 1/3 as many points as a win and drops 2/3 of a loss. This accounts for all points both gained and dropped.
  • Ties are definitionally close games.
  • If you are a good team and want to avoid draws you can most directly do that by winning by a lot.
  • If you play a lot of close games you are likely to have more draws. You also leave yourself more open to the effects of chance like flukey deflections. To the extent that means more draws, you should count them with the close games.
Any model is a shortcut. Modeling a 3 outcome system is much more complicated than 2. Reducing it to an adjusted form of the two true outcomes makes it much easier to work with. Though it reduces accuracy, I'm not sure the extra juice is worth the squeeze, and I also do not believe it adds bias in any direction that matters. I think it's just a little fuzzier and less accurate in a way I can live with. If there is a bias, it is against close games, especially if you're good. I think this is a positive feature of the model. And I'm confident that bias is the same for all teams, all coaches, and seasons.

Again, on aggregate, good teams don't want ties, and I believe a model that makes close games seem worse because they are more likely to be draws is good. If you ask "but what if a good team rescues a point 80% of the time it was losing after 70'?" I will respond that a good team shouldn't find itself losing late so often that it matters much. As for the desirability of draws in Away games: in NYC's best Away season (2019) they had 5 Away draws. In their worst Away season (2023) they had 8 Away draws. That doesn't always line up. There's a lot of randomness in draws! But generally (1) draws are more bad than good, and (2) close games are more likely to be draws, so (3) a model that saddles close games with the bad effect of draws is fair.
 
Back
Top